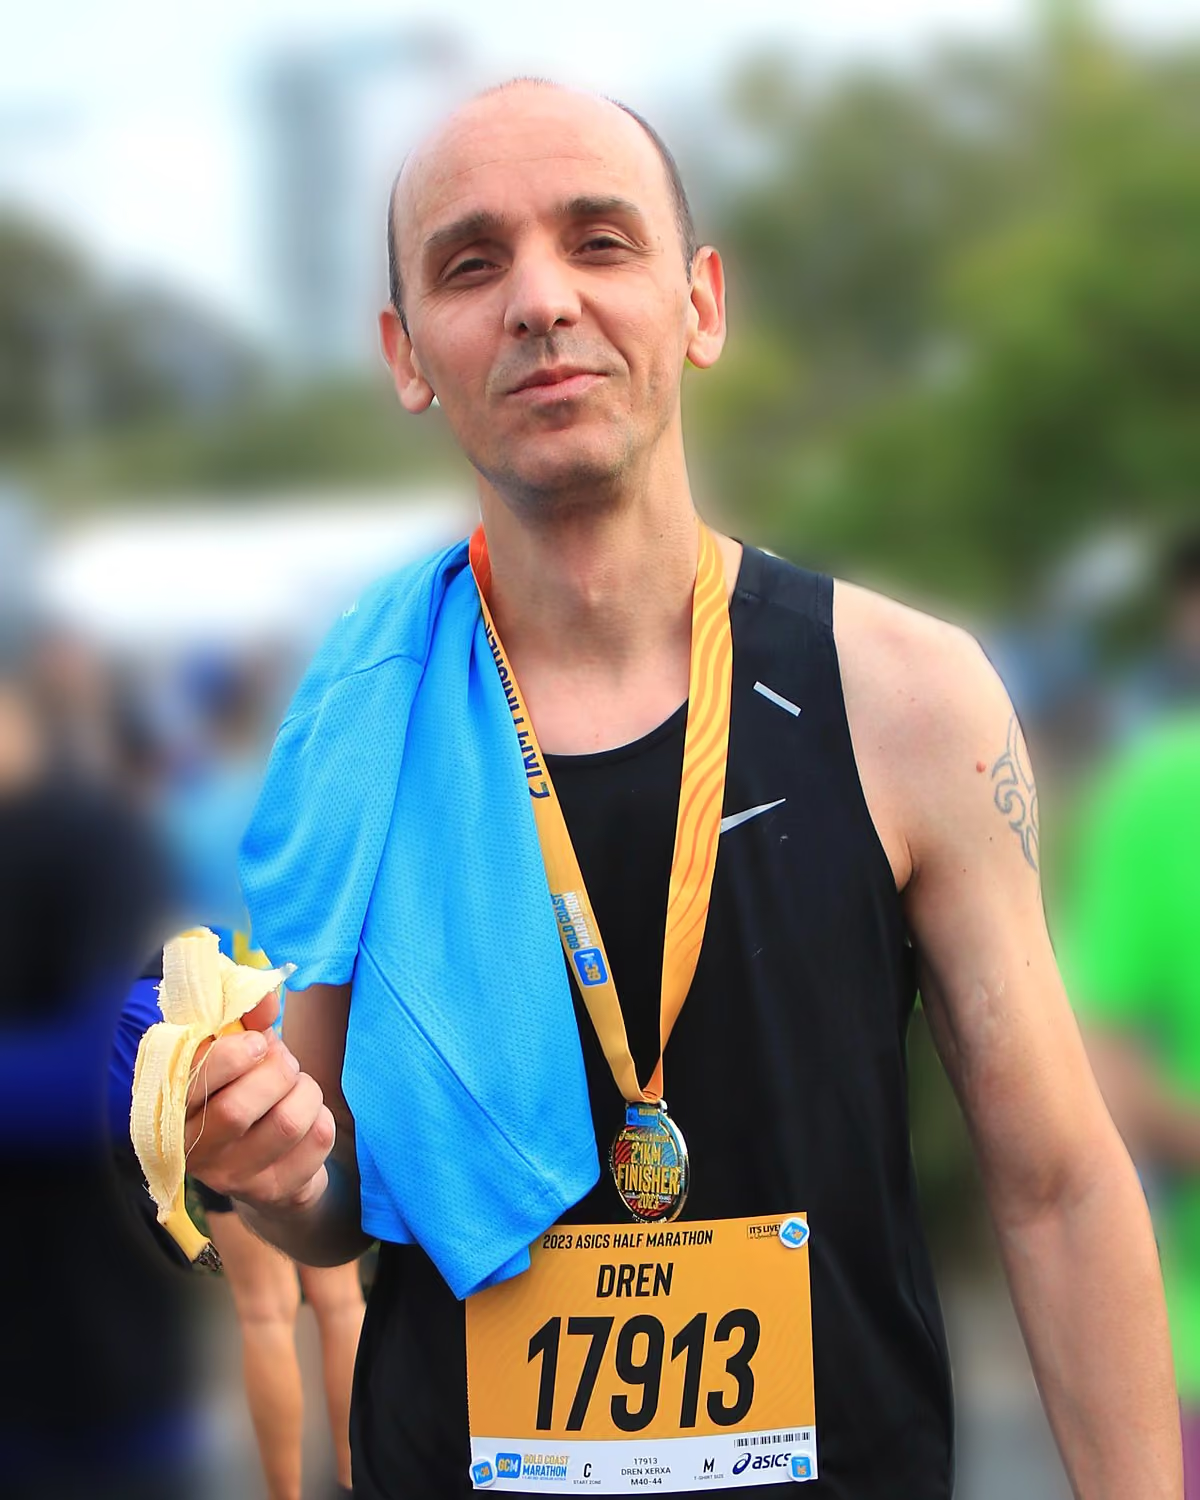
Look inside.
Run stronger.

Testing and insights built for runners. Track the biomarkers behind energy, recovery and endurance, explained in plain English. No GP referral needed.

Find my panel

Test at 4,000+ centres.

Referral included.
Australia map
Runner training at sunrise
nutripathBGT partners LX Health accelerator Healius partner center 4cyte partner center
nutripathparkrun community logo BGT partners LX Health accelerator 4cyte partner center nutripath

Why runners choose SuperRun

Icon

Built for runners

Track the biomarkers that matter most for runners and get clear, useful guidance.

Icon

Accessibility  

Test anywhere in Australia with fast, flexible sample collection in 4,000+ centres. No GP referral needed.

Icon

Upfront pricing

Simple, upfront pricing for every panel with no hidden fees, and no confusing memberships.

See the biomarkers that drive your energy, recovery, and performance - all in one simple test.

Choose your panel

Brisbane run

RunBase

The essential health check every runner should do at least once a year.

Icon
40+ biomarkers
What's included
Core Vitamins            
Electrolytes & Hydration
Iron + Oxygen Status
Liver & Kidney Function
Inflammation & Blood Sugar
Who is it for
Everyday runners     
Annual health check
See RunBase ($299)

Endura

Built for runners in training. Track recovery, manage load & see your body adapt.

Icon
50+ biomarkers
What's included
All in RunBase         
Muscle Damage & Recovery
Training Adaptation
Zinc & Mineral Stores
Training Stress (Cortisol)
Who is it for
Half / Full Marathon prep
Building endurance
See Endura ($429)
Morning run

RunHer

Built for female runners. Hormones, thyroid & cycle performance in one test

Icon
50+ biomarkers
What's included
All in RunBase          
Female Hormone Profile
Full Thyroid Panel
Hormones & Bone Health
Cycle & Energy Tracking
Who is it for
Female runners only
Fatigue or cycle issues
See RunHer ($499)
Competitive run

Elite

Professional-grade for peak optimisation, longevity & complete hormonal health.

Icon
70+ biomarkers
What's included
Full Baseline + Advanced
Adv. Metabolic Health
Peak Performance Hormones
Elite Kidney
Cardiovascular Risk
Who is it for
Competitive athletes
Performance optimisation
See Elite ($890)

How SuperRun works

Choose the panel that matches your running goals. Once booked, we’ll email your referral, confirmation, and collection info.

Panels designed by performance
No GP referral needed – we provide it
Referral is delivered instantly by email
Clear, upfront pricing
Icon
Energy levels
Icon
Hydration status
Icon
Endurance capacity
Icon
Recovery quality
Run

Book your test

Visit one of 4,000+ partner collection centres around Australia. NATA accredited professionals handle the collection quickly and safely.

4,000+ collection centres around Australia
Professional sample handling by NATA-accredited providers
Fast and convenient
Nationwide access
Australia map

Sample
Collected

Your results will be delivered securely to your private SuperRun dashboard within a few days, including optimal ranges and clear explanations for every biomarker. You’ll also receive a follow-up email report with personalised SuperRun insights.
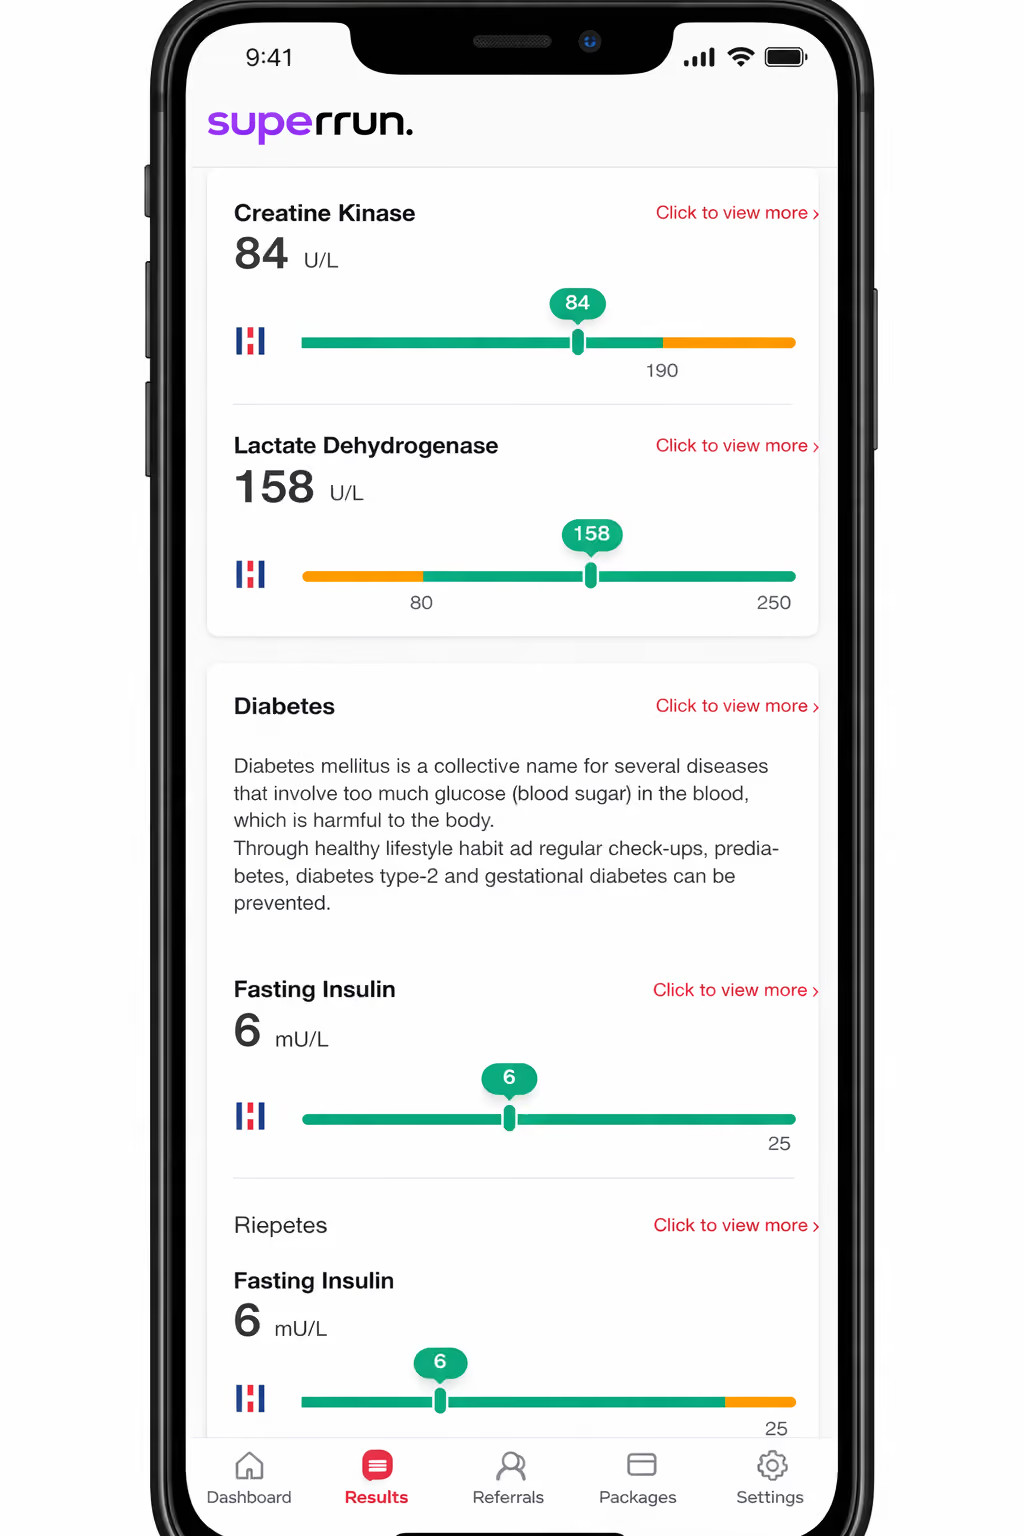
Results delivered in your private dashboard
Easy to read and understand
Personalised insights for runners
Secure and confidential
Blood biomarker dashboard for runners

Your results & insights are ready

Transformative outcomes backed by data

5.1 X

Higher Risk of Fracture.

Research suggests runners with low Vitamin D are several times more likely to develop a stress fracture.

Dashboard
Protected
Fracture Zone
Icon

Unlock Hidden Speed

+

5

%

VO2 Max Boost.

Research links higher haemoglobin with greater oxygen-carrying capacity in endurance runners.

Engine Room
-
14
%

Endurance Ceiling

Time to Exhaustion.

Athletes with depleted iron stores (Ferritin <20) reach exhaustion 14% faster, even if they are not clinically 'anemic'.

Icon
Energy Levels
Icon
Oxygen Transport
Icon
Recovery Quality
Muscle Repair
Training Load
CK Levels
Muscle Repair
Training Load
CK Levels
Muscle Repair
Better recovery

48H

Recovery Window.

CK levels reveal if your muscles have recovered - or if you're still training on damage.

Energy
Endurance
Recovery
Hydration
Stress load
Inflammation
Energy
Endurance

Your results, explained for runners

Your dashboard

Each marker, with your range, trend over time and plain-English meaning.

Your insights report

Recovery & Fatigue - an example

The internal environment your body adapts and rebuilds in between sessions - low inflammation and recovered muscle markers are what runners look for here.
Inflammation    
CRP 
mg/L · Race-Ready
Muscle Damage
CK · U/L · Race-Ready
Icon
Energy & Iron Levels
Icon
Recovery Quality
Icon
Inflammation & Stress
Icon
Endurance Capacity
Icon
Hydration & Electrolytes
Icon
Energy & Iron Levels
Icon
Recovery Quality
Icon
Inflammation & Stress
Icon
Endurance Capacity
Icon
Hydration & Electrolytes
Icon
Energy & Iron Levels
Icon
Recovery Quality
Icon
Inflammation & Stress
Icon
Endurance Capacity
Icon
Hydration & Electrolytes

Take control of
your running
and health today.

Join Superrun and unlock personalised insights that help you train smarter, recover faster, and make training decisions with real data